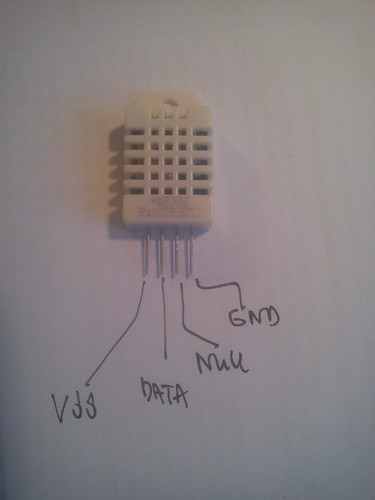
 Fig. #1: DHT-22 sensor
 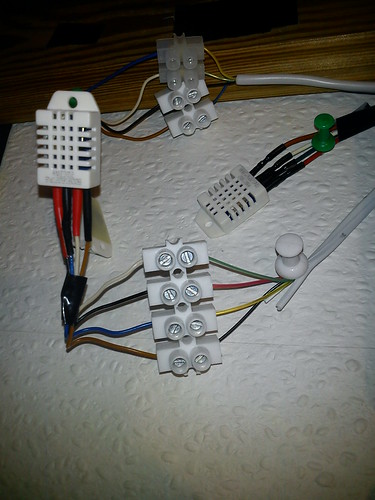 Fig. #2: Testing DHT-22
 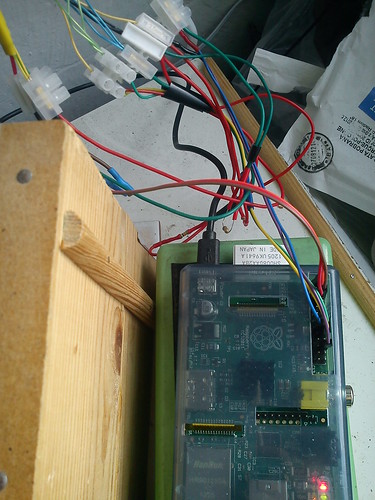 Fig. #3: Wiring
 To build the installation one has to buy:
DHT-22 temperature/humidity sensor (8 USD per sensor). Not cheap...
0,25W 10K OHM carbon resistor (very cheap).
female connectors (pol. kable połączeniowe żeńskie), telephone cables or similar four core cable (pol. kabel czterożyłowy), terminal block (pol. kostka połączeniowa) and heat shrink tubing (pol. rurka termokurczliwa) to insulate and strengthen connections. The recommended way is to use a breadboard (pol. płytka stykowa/prototypowa) as described in learn.adafruit.com. My interest in electronics is limited, I've never used breadboards etc... I had some spare cables and terminal blocks so I designed it that way (cf. pictures).
NOTE: The cheaper version of the DHT-22 is a DHT-11 (aka SHT-11). Tempted by the lower price I bought two DHT-11 sensors but I do not recommend it. First of all, the temperature is measured in the range of 0 °C to 50 °C (with poor accuracy of +/- 2 °C) so is not suitable for outdoor (at least in Europe). Second, the humidity seems to be understated. Third, it does not work when DQ line is connected to other GPIO pins than pin #24 (maybe it's a software problem). For comparison, DHT-22 measures the temperature in the range of-40C to +80 C with an accuracy of +/- 0.5 °C.
I follow the tutorial available at learn.adafruit.com but some details were modified.
Hardware
There are four pins in DHT-22 (see Figure # 1). I connected data line (DQ) of each sensor to pins P22, P24 and P25 respectively (each sensor must have a separate data line). Vdd pin of each sensor to P1 (3.3 V supply). GND (ground) pin of each sensor to P6. In addition, each DQ was connected via the resistor with the power line Vdd.
Pin Null is not used.
The sensors were connected to GPIO pins via terminal blocks, cables and some soldering.
Software
One has to download, compile and install the necessary library:
pi@raspberrystar $ wget http://www.open.com.au/mikem/bcm2835/bcm2835-1.8.tar.gz
pi@raspberrystar $ tar -zxvf bcm2835-1.8.tar.gz
pi@raspberrystar $ cd bcm2835-1.8
pi@raspberrystar $ ./configure && make && sudo make install
then the application retrieving the data from the sensors has to be installed:
pi@raspberrystar $ git clone https://github.com/adafruit/Adafruit-Raspberry-Pi-Python-Code.git
pi@raspberrystar $ cd Adafruit-Raspberry-Pi-Python-Code
pi@raspberrystar $ cd Adafruit_DHT_Driver
One has to modify Makefile file, namely add -l rt at the end of the line that starts with CFLAGS:
CFLAGS = -std=c99 -I. -lbcm2835 -l rt
now:
## in Adafruit_DHT_Driver directory
pi@raspberrystar $ make
If everyting works, then:
# Run ./Adafruit_DHT sensor-type DQ-pin-number
pi@raspberrystar $ sudo ./Adafruit_DHT 22 25
Using pin #25
Data (40): 0x3 0xe7 0x0 0x17 0x1
Temp =  2.3 *C, Hum = 99.9 %
The directory Adafruit_DHT_Driver contains also Adafruit_DHT_googledocs.ex.py Python script which can upload sensor readings directly to google.docs spreadsheet. To run Adafruit_DHT_googledocs.ex.py one has to install gspread module first:
pi@raspberrystar $ wget http://pypi.python.org/packages/source/g/gspread/gspread-0.0.13.tar.gz
pi@raspberrystar $ tar -zxvf gspread-0.0.13.tar.gz
pi@raspberrystar $ cd gspread
pi@raspberrystar $ sudo python setup.py install
Adafruit_DHT_googledocs.ex.py script: 1) in an infinite loop runs every 30 seconds the program Adafruit_DHT, 2) retrieves temperature/humidity, 3) sends temperature/humidity readings to google.docs. A fragment of the script looks like:
while(True):
 output = subprocess.check_output(["./Adafruit_DHT", "2302", "4"]);
 print output
 # search for humidity printout
  matches = re.search("Hum =\s+([0-9.]+)", output)
  if (not matches):
        time.sleep(3)
        continue
  humidity = float(matches.group(1))
  ## omitted code ...

 time.sleep(30)
Because I want to process somehow the data (not only to retrieve and upload to google.docs) I modify Adafruit_DHT_googledocs.ex.py script. My version Adafruit_DHT_googledocs.ex.py is limited to sending to google.docs values passed as arguments to the call:
temp = float(sys.argv[1])
humidity = float(sys.argv[2])
## omitted code ...
The following bash script takes care of the rest:
#!/bin/bash
#
LOG_DIR=/home/pi/Logs/DHT
BIN_DIR=/home/pi/bin
SENSTYPE=22
SLEEP_TIME=5

function ReadSensor() {
   local sensorType="$1"
   local sensorId="$2"
   local WYNIK=""
   local SUCCESS=""

   ## 5 tries with 5s sleep between them
   for i in 1 2 3 4 5; do
      WYNIK=`sudo $BIN_DIR/Adafruit_DHT $sensorType $sensorId | tr '\n' ' '`
      SUCCESS=`echo $WYNIK | awk ' { if (NF > 10) {print "YES"} else { print "NO"}}'`

      if [ "$SUCCESS" = "YES" ] ; then
         echo "$sensorId=$i $WYNIK" >> $LOG_DIR/DHT22.log
         DHT_CURR_TEMP=`echo $WYNIK | awk '{print $13}'`
         DHT_CURR_HUM=`echo $WYNIK | awk '{print $17}'`
         break
      fi
      sleep $SLEEP_TIME;
      done

      ## All attempts to read sensors were unsuccessful
      if [ $SUCCESS = "NO" ] ; then
         echo "$sensorId=? $WYNIK" >> $LOG_DIR/DHT22.log
         DHT_CURR_TEMP="999.9"
         DHT_CURR_HUM="999.9"
      fi
}
echo "@`date "+%Y%m%d%H%M%S"`" >> $LOG_DIR/DHT22.log

## A sensor in the room:
ReadSensor $SENSTYPE "24"
READINGS="$DHT_CURR_TEMP $DHT_CURR_HUM"
sleep 12

## Outdoor sensor:
ReadSensor $SENSTYPE "25"
READINGS="$READINGS $DHT_CURR_TEMP $DHT_CURR_HUM"
sleep 12

## A sensor in the porch:
ReadSensor $SENSTYPE "22"
READINGS="$READINGS $DHT_CURR_TEMP $DHT_CURR_HUM"

## HTML + chart
/usr/bin/perl /home/pi/bin/dht2ht.pl > /var/www/stats/DHT22.html

# Upload to google
/home/pi/bin/DHT_googledocs.ex.py $READINGS
As in the case of 1-Wire bus there are problems with the reading of the sensor. That's why the function ReadSensor is trying to read the sensor several times. Maximum number of failed attempts, we have observed during several days of operation is 3.
The script runs every 30 minutes from cron:
1,31 * * * * /home/pi/bin/dht2ht.sh
LOG file looks something like this:
@20121113230101
24=1 Using pin #24 Data (40): 0x2 0x22 0x0 0xc9 0xed Temp =  20.1 *C, Hum = 54.6 %
25=1 Using pin #25 Data (40): 0x3 0xe7 0x0 0x1c 0x6 Temp =  2.8 *C, Hum = 99.9 %
22=4 Using pin #22 Data (40): 0x2 0x73 0x0 0xb0 0x25 Temp =  17.6 *C, Hum = 62.7 %
Row starting with the @ contains the date and time (@ is added for subsequnt easy parsing). Lines that begin with nn = m contain the data retrived from the sensor (nn is the sensor number, m denotes the number of successful attempt or ? in case when all attempts were unsuccessful)
Note: I noticed that higher system load (including intensive I/O operations) cause problems to retrieve data from the sensors. I tried to run motion detection application (motion) configured to use as little system resources as possible with no success. Rapberry overclocked to 900 Mhz performs significantly better but still only about 20% tries returns some data. Exact nature of the problem is a mystery to me as for example top indicates that still more there 80% of CPU is free.
Other question to consider is: whether the readings are correct during high humidity? My outdoor sensors tend to indicate 99% humidity pretty frequently which seems suspicious. I have compared data obtained from 3 different sensors (namely WH 2080 clone, Oregon Scientific's RMS300 and DHT-22) and some differ significantly.
Conversion to HTML and generating charts with dht2ht.pl
Perl script dht2ht.pl creates a HTML table and charts showing temperature/humidity readings as well as dew point, calculated with the following approximation formula: $$ D_p = (237.7 \cdot \gamma(T, H) ) / (17.271 - \gamma(T, H) ) $$
where: $$ \gamma(T, H) = 17.271 \cdot T / (237.7 + T) + \log (H / 100.0) $$
Script outcome is available here. All scripts and other stuff discussed in this blog post are available here.
Google.docs sheet containing readings from all my 3 sensors is available here. (Note: for some important reasons Adafruit_DHT_googledocs.ex.py script started adding data from the 162th line of the spreadsheet.)

